
GitHub Octoverse 2026 Report. I’m attending GitHub Universe today (GitHub gave me a free ticket through their “GitHub Stars” program). Jay Parikh, EVP, just released this year’s Octoverse report, highlighting the following figures:
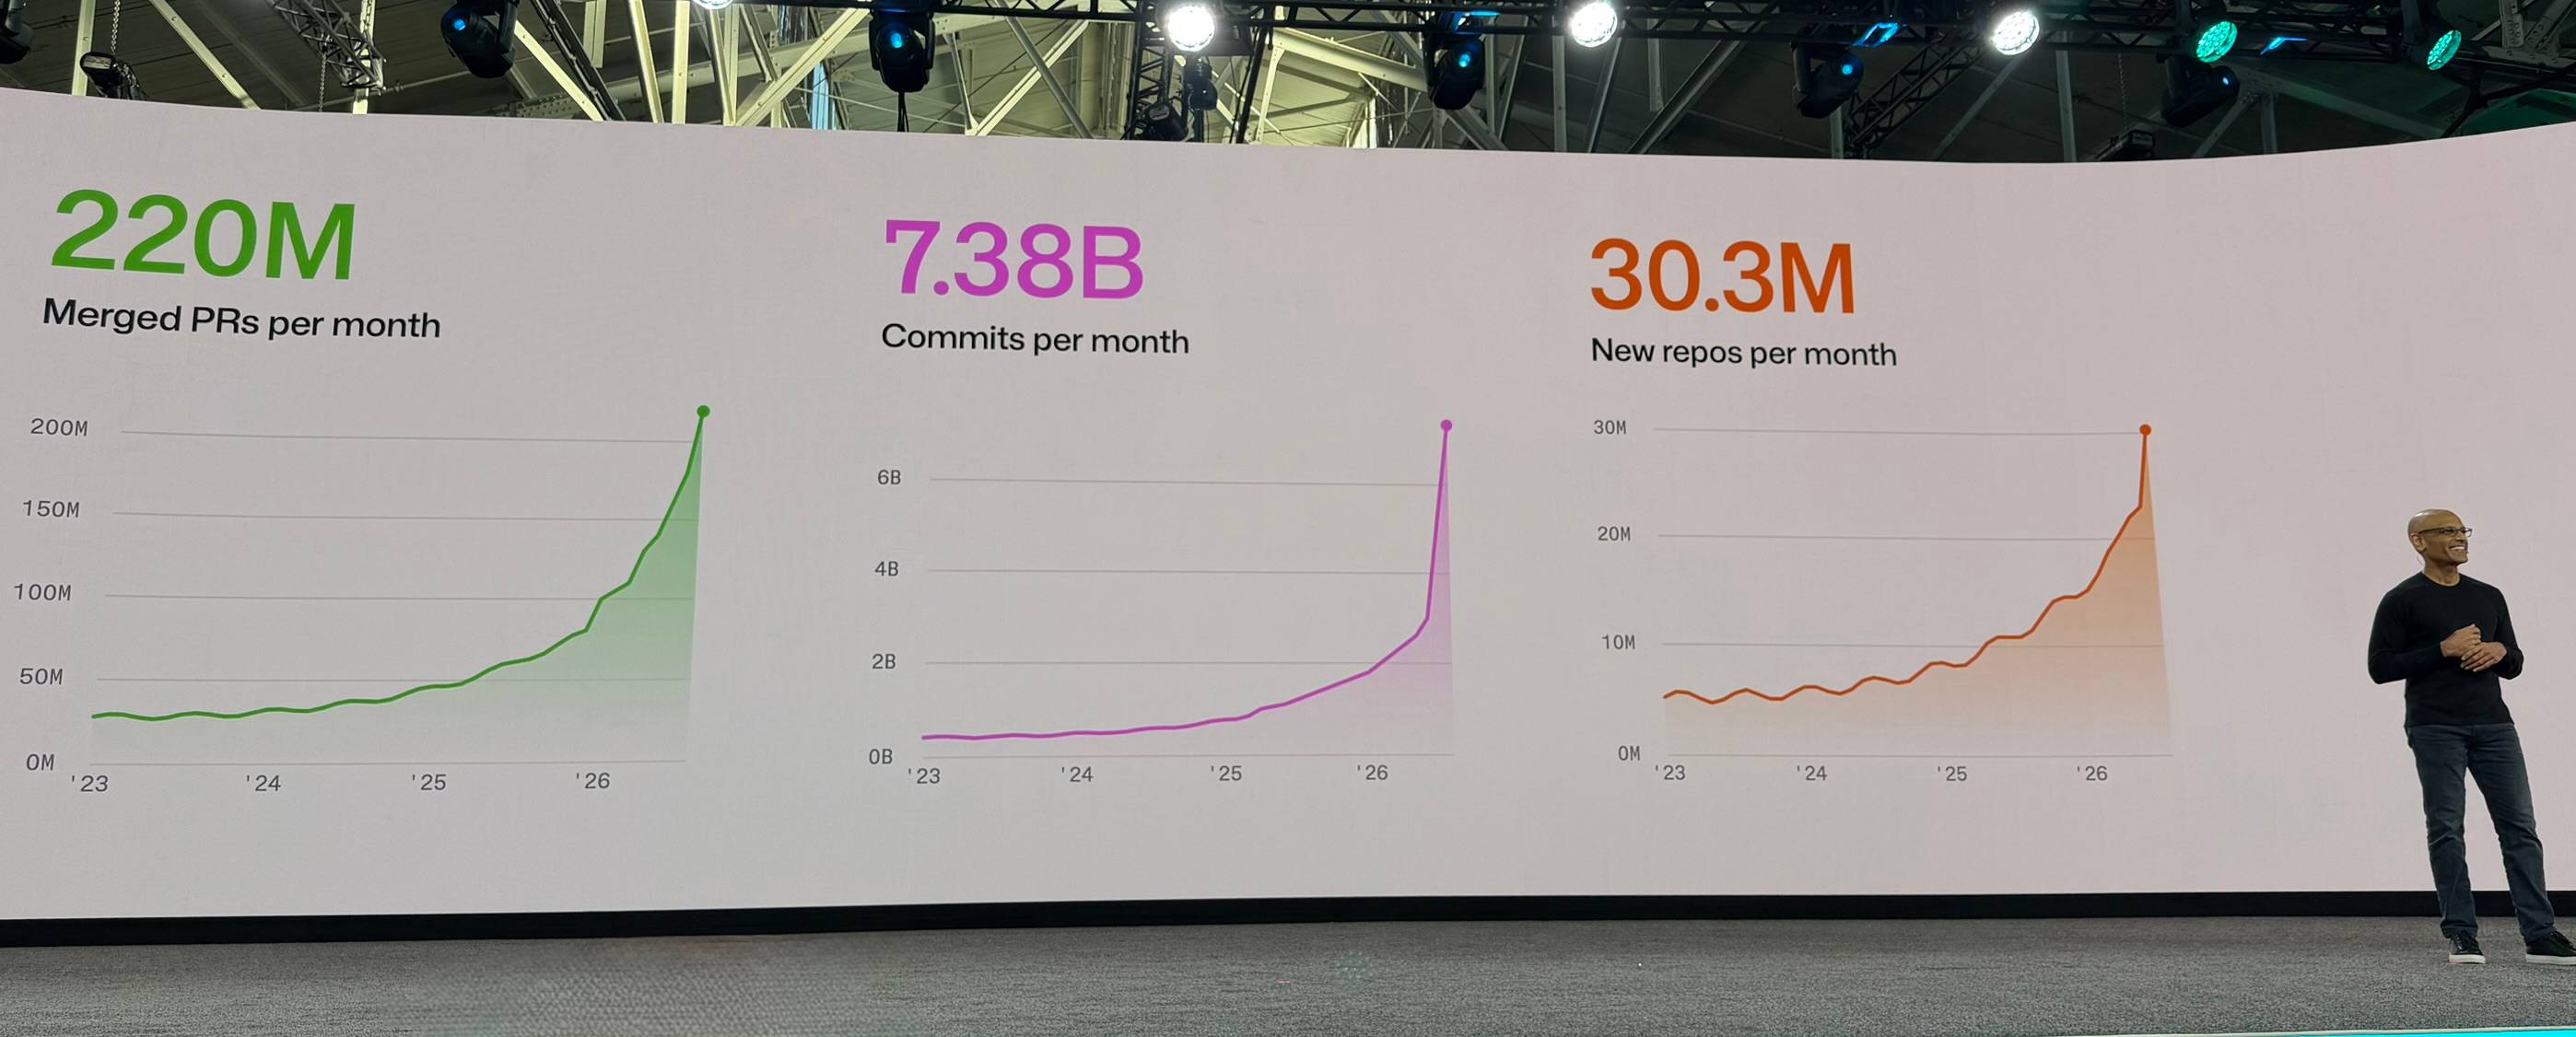
This provides an incredibly vivid look at the impact of agentic engineering on GitHub. In 2026, monthly merged pull requests (PRs) tripled in under a year, reaching 220 million per month. Monthly commits more than tripled to 7.38 billion per month, with most of that growth occurring in the second half of the year. The rate of new repository creation doubled this year, reaching 30.3 million per month.
The report also includes new data broken down by industry, along with dedicated figures for repositories involving “interoperability or reverse engineering.” The methodology section explains how they compiled these metrics:
Top countries and regions by pushes to public repositories (calibrated for profile location). Aggregated counts of pushes per country/region across the Octoverse year. To eliminate VPN-induced bias, we used LLM classification to extract ISO 3166-1 alpha-2 codes from the profiles of GitHub users who contributed pushes during this period […]
Industry. A fine-tuned multilingual embedding model was used to classify a random sample of public repositories created each year between 2022 and 2026 into North American Industry Classification System (NAICS) sectors, using repository names, descriptions, topics, and README information. […]
Interoperability. Count of public repositories created each year whose name, description, topics, or README mention interoperability, reverse engineering, or related terms (such as clean room implementation, drop-in replacement, or protocol re-implementation).