
October 22, 2026 · Research
Maxim Neumann and Charlotte Stanton
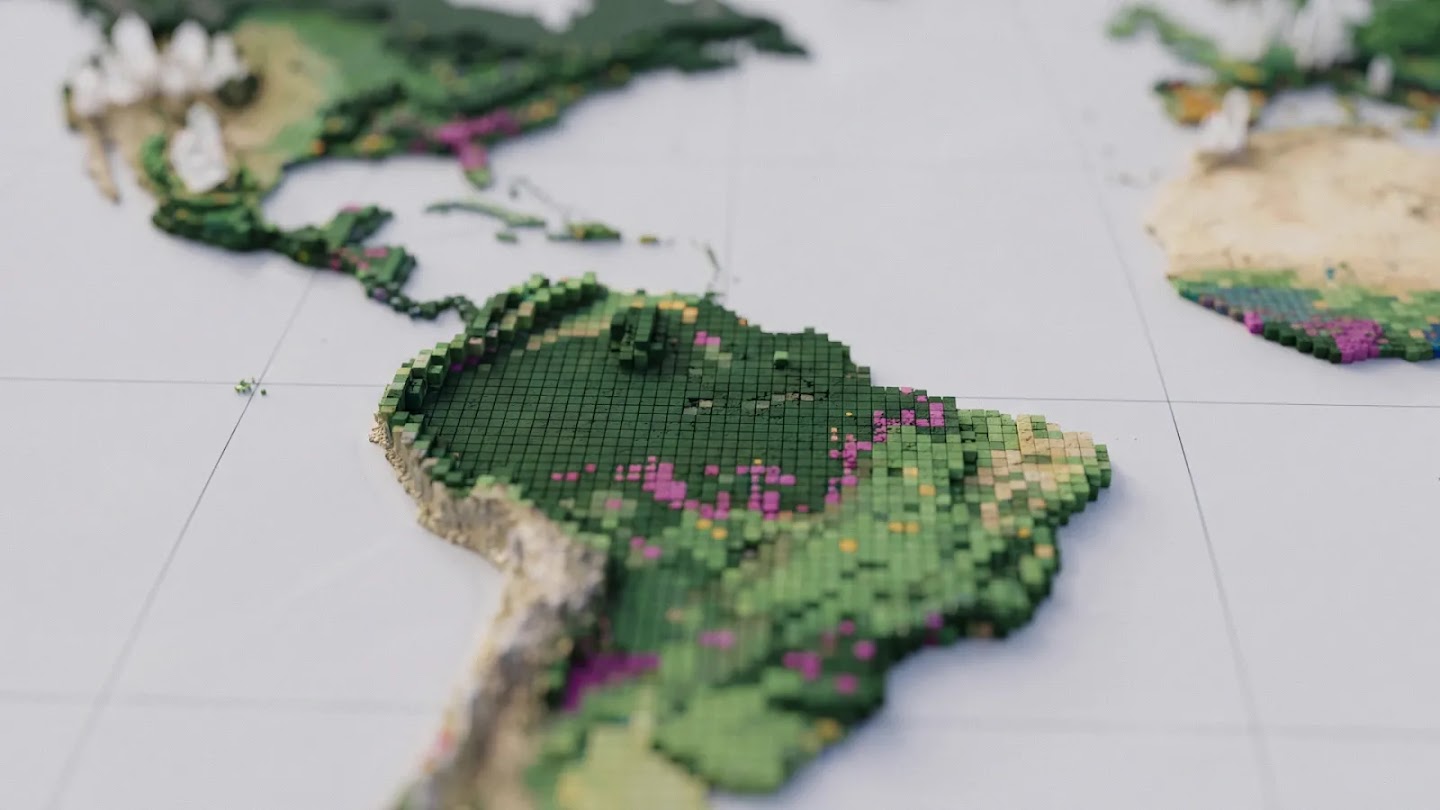
A new 10-meter resolution map reveals which of the world’s forests are natural, planted, or agricultural, and how they are changing over time
Protecting Earth’s forests begins with a simple question: What kind of forest are we actually looking at? From space, a pristine tropical rainforest, a eucalyptus timber plantation, and an oil palm grove can appear as identical patches of green. Yet the carbon storage and biodiversity they harbor are worlds apart. Distinguishing between them and understanding how each parcel of land changes over time can show us where conservation efforts are working—and where natural forests are being converted into plantations and farms.
Today, Google DeepMind and Google Research, in collaboration with the World Resources Institute (WRI) and the International Institute for Applied Systems Analysis (IIASA), are releasing the Forest Typology 2020 (ForTy). This global map classifies every 10×10-meter parcel of land across the globe into six distinct forest and land-use types, establishing a critical baseline for EU deforestation regulations. At the same time, we are also sharing early time-series data tracking annual changes in these forests from 2017 to 2025, including areas where natural forests have been replaced by plantations or farms. For the first time, users worldwide can not only see where forests are being lost year by year at a 10-meter resolution, but also uncover what is taking their place: timber plantations, tree crop farms, or other land uses.
Why looking at “tree cover” alone is far from enough
All forests store carbon, and together they are home to the vast majority of Earth’s terrestrial plant and animal species. However, a forest’s ecological value also depends on its history: a primary forest that has never been logged harbors far greater carbon stocks and biodiversity than a monoculture timber plantation harvested every decade or two.
Most global maps only indicate the presence or absence of trees. This poses a major challenge for those working to protect natural forests. For instance, the EU Deforestation Regulation (EUDR) mandates that commodities such as coffee, cocoa, or palm oil must not originate from land that was forested in 2020 but subsequently converted to agricultural use. Similarly, wood products like furniture must be free from the risk of forest degradation: they cannot come from primary forests that were later converted into plantation forests or planted forests, nor from naturally regenerating forests that were later converted into plantation forests. As a result, businesses and regulators need to know not only where trees are located, but also what type of forest they comprise (primary vs. regenerating, planted vs. plantation, forest vs. farm), and what replaces them after deforestation.
Last year, we co-released Natural Forests of the World 2020, a 10-meter resolution global map that distinguishes natural forests from all other tree cover. It provided a starting point to help companies and regulators implement EU deforestation regulations and to support commodity producers in fulfilling their commitments to avoid destroying natural forests. That map answered just one question for each parcel of land: was it a natural forest in 2020? ForTy goes a step further by identifying the specific type of forest present—from primary forests and timber plantations to tree crops—and showcasing its year-by-year evolution through a new time series.
How ForTy classifies the world’s forests
Specifically, based on definitions from the Food and Agriculture Organization of the United Nations (FAO), ForTy classifies land into six broad categories:
- Primary forest: Native forests with no clearly visible indications of human activities.
- Naturally regenerating forest: Forests that re-establish naturally, such as after logging or fire.
- Planted forest: Forests established through planting or deliberate seeding and managed over long cycles.
- Plantation forest: Fast-growing, intensively managed tree plantations, typically of a single species.
- Tree crops and agroforestry: Farms cultivating non-timber crops, such as oil palm, rubber, cocoa, or fruit.
- Other land: All other land types, including grasslands, croplands, urban areas, and water bodies.
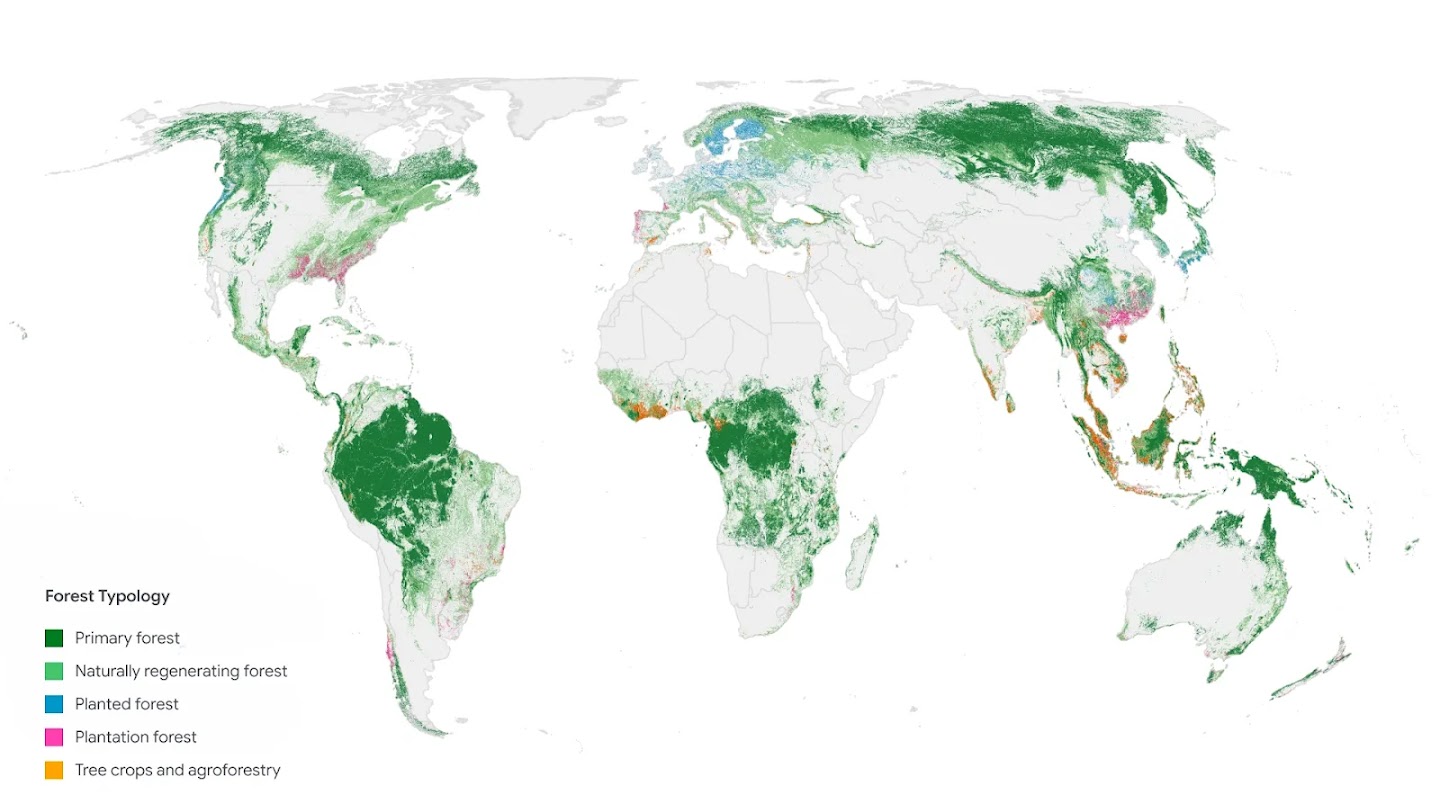
Forest Typology 2020. Each color represents the most common forest or land type per square kilometer. Feel free to explore at 10-meter resolution in our Earth Engine app.
Training the ForTy model was challenging because these classifications depend not only on appearance, but also heavily on how the land is used. To teach the model to distinguish these differences, we assembled a massive library of forest type samples containing approximately 1.7 million labeled locations, sourced from expert surveys, national and regional datasets, and targeted reviews in areas where the model was less certain. The model uses a custom architecture designed specifically to address the challenges of remote sensing data, taking AlphaEarth Foundations embeddings as a critical input—a compact summary of multi-year satellite observations for every 10-meter pixel, enabling it to pick up on subtle clues such as planting patterns, growth cycles, and harvesting rhythms.
![Figure 41: Five satellite images showing different forest classification types: naturally regenerating forest, primary forest, planted forest, plantation forest, and tree crops/agroforestry.](https://lh3.googleusercontent.com/l0vzsdd-HHJUPQaQCHx4yzAOG-ULvQ20EM0Hypo